Accounts and usage
Statistics
Statistics show what your agents have consumed: tokens, cost and prompts by day, week or month, broken down by project, model, agent, ticket and account.
Open the statistics
Click “Stats”, at the top right of the window. The page replaces the project on screen; a click on a project’s tab takes you back to it. It has no shortcut.
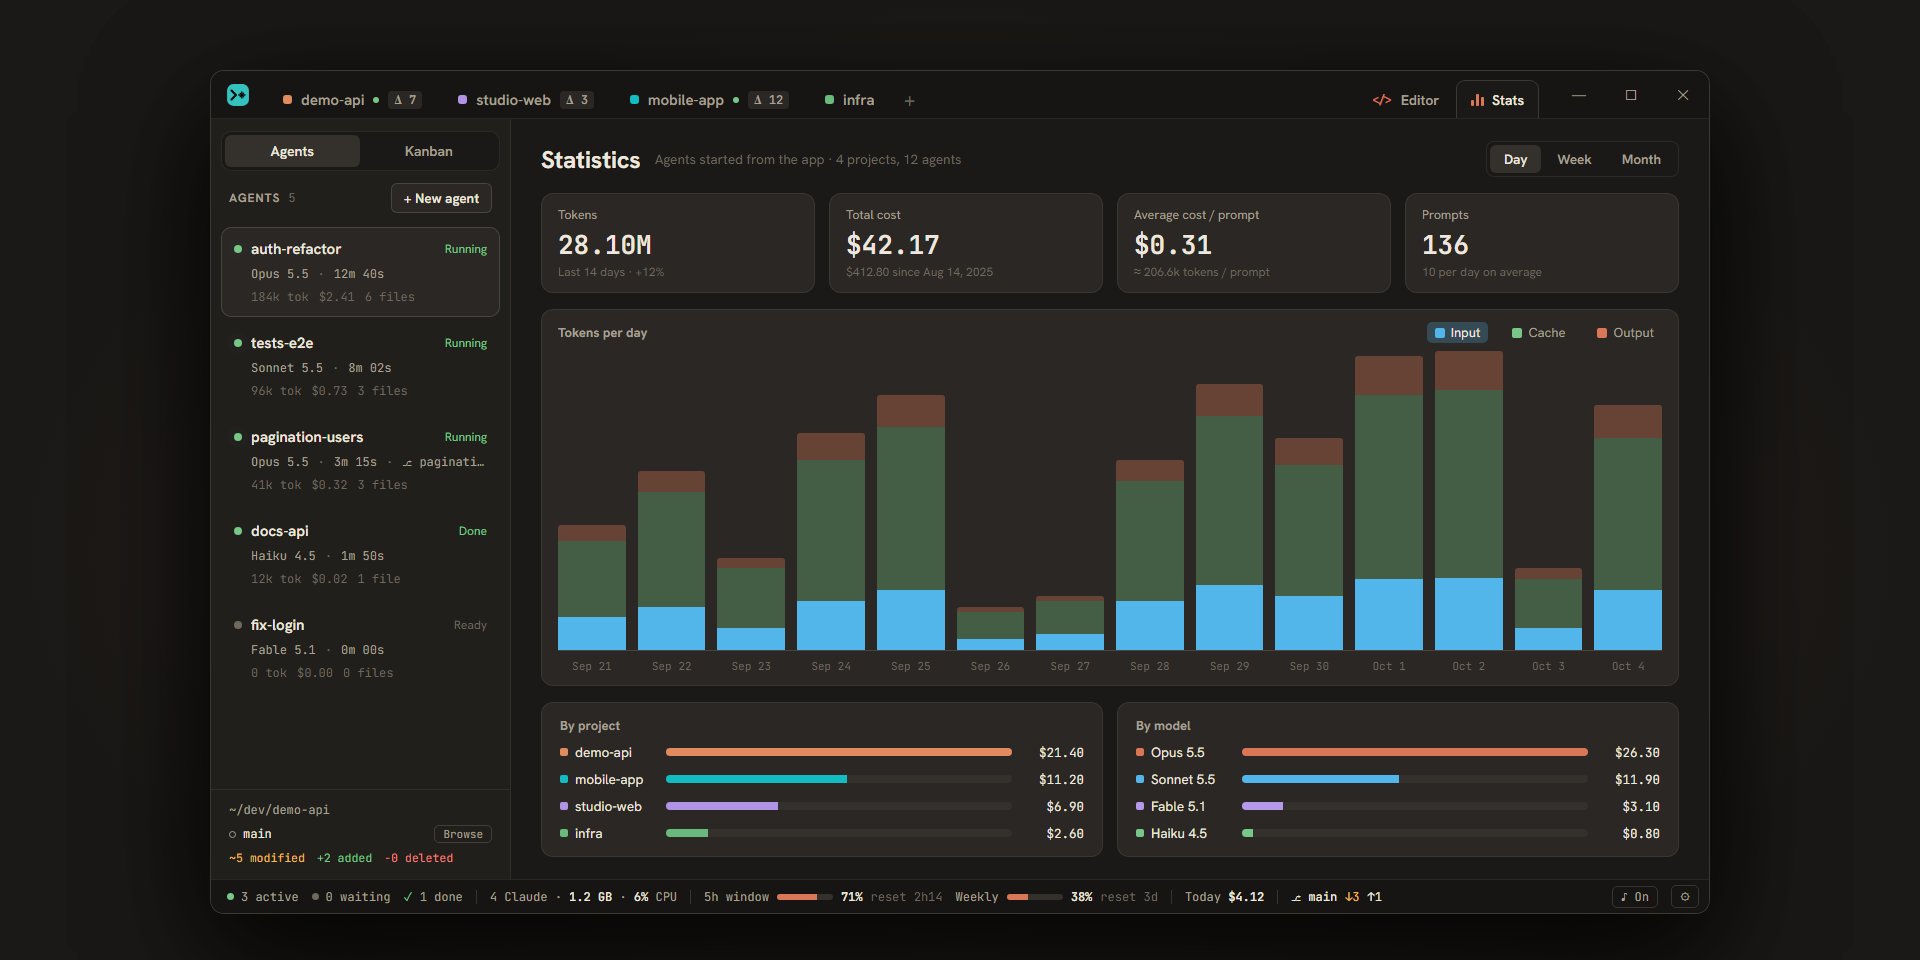
The header recalls what is counted: “Statistics”, then for example “Agents started from the app · 4 projects, 12 agents”. Only agents started from Escouade count: what you do in Claude Code outside the app isn’t there. The page refreshes by itself when a turn ends.
Choose the period
The selector at the top right offers “Day”, “Week” and “Month”. Your choice is kept from one launch to the next.
| Choice | Steps of the chart | Compared with |
|---|---|---|
| Day | The last 14 days, today included (“Sep 27”) | The 14 days before |
| Week | The last 12 weeks, Monday to Sunday (“W39”, the ISO week number) | The 12 weeks before |
| Month | The last 12 months (“Oct”, “Sep”…) | The 12 months before |
The last step is in progress: today, the current week or the current month.
The indicators
Four cards sum up the period:
| Card | Value | Line below |
|---|---|---|
| “Tokens” | The period’s tokens: input, cache and output added up. | “Last 14 days · +12%”: the change from the previous period. With nothing to compare to, only the span is written. |
| “Total cost” | The period’s cost. | The all-time cost since the first recorded turn, for example “$412.80 since August 14, 2025” (or “$412.80 in total”). |
| “Average cost / prompt” | The period’s cost divided by its number of prompts. | “≈ 206.6k tokens / prompt”. With no prompt, “—” and “no prompts in this period”. |
| “Prompts” | The number of prompts in the period. | “10 per day on average” (per week, per month). |
A prompt is a message delivered to an agent.
The chart
The “Tokens per day” chart (“per week”, “per month”) has one bar per step. Each bar stacks three series, recalled in the legend:
| Series | What it counts |
|---|---|
| “Input” | The tokens sent to the model, outside the cache. |
| “Cache” | The tokens read from the prompt cache or written to it. |
| “Output” | The tokens the model produced. |
Hover a bar to read the step’s details: the three series, the total, the cost and the number of prompts. The “Table” button replaces the chart with a table of the same figures (“Period”, “Input”, “Cache”, “Output”, “Total”, “Cost”, “Prompts”); “Chart” brings it back.
The breakdowns
Under the chart, the period is cut up in several ways.
By project and by model
Two lists side by side, ranked by tokens. Each line has a name (the project’s color in front of its name), a bar proportional to the heaviest line, the tokens and the cost. A project closed since shows as “Closed project”.
By account
With several accounts, the “By account” table puts the accounts side by side, from the most to the least expensive, with the columns “Account”, “Tokens”, “Cost”, “Turns” and “Agents”. A turn is one reply from Claude; “Agents” counts the distinct agents that ran on the account during the period. An account removed since stays listed as “Deleted account (pro)” (its id in parentheses).
By agent
The “By agent” table lists the period’s agents, from the most to the least expensive, with their project, their tokens and their cost. It also counts archived agents; a deleted agent keeps its row, as “Deleted agent”.
By ticket
The “By ticket” table adds up what each ticket’s agents cost: “Ticket”, “Title”, “Loops” and “Cost over the period”, from the most to the least expensive. With no ticket, “No tickets in this period.”
The agent and ticket lists show 20 rows. “Show all” unfolds the rest, “Show less” folds it back, and “20 of 57” tells you where you are.
Filter by account
With several accounts (or turns recorded on several), an “Account” menu appears to the left of the period selector. It offers “All accounts”, each account, and the removed accounts the statistics still know about.
Choosing an account narrows the indicators, the chart and the by-project, by-model, by-agent and by-ticket lists to it, as well as the comparison with the previous period. The “By account” table stays complete, with the chosen account’s row highlighted. The choice isn’t kept: the page always opens on “All accounts”.
For the accounts themselves, see Several Claude accounts.
Where the figures come from
The figures are in stats.db, a SQLite database in Escouade’s data folder (~/.escouade/, see local data).
- At the end of each turn, Escouade writes one row per model used: the date, the agent, the project, the model, the input, cache and output tokens, the cost and the account. The cost is Claude Code’s exact figure: the status bar’s “≈” estimate doesn’t go in (see Quotas and cost).
- Each message delivered to an agent is noted as a prompt, with its date, the agent, the project and the account.
- The conversations’ content isn’t in there.
- A turn’s account is the one the agent had at that moment: an agent resumed on another account counts on that one afterwards.
- Archiving or deleting an agent, or closing a project, doesn’t erase its rows: they stay in the totals.
When the statistics can’t be read, the page writes “Statistics unavailable:” followed by the error.